Construct the requested histogram.
-Each person from a group of recently graduated math majors revealed the number of job offers that he or she had received prior to graduation. The compiled data are represented in the table.
Construct the probability histogram for the number of job offers received by a graduate randomly
Selected from this group. 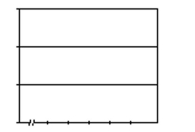
A) 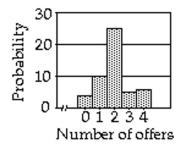
B) 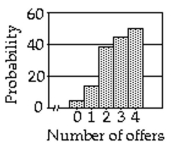
C) 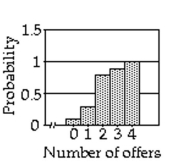
D) 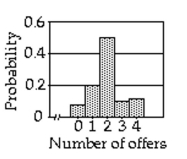
Correct Answer:
Verified
Q133: Find the standard deviation of the
Q134: Determine the possible values of the
Q135: Evaluate the expression.
-(22 - 12)!
Q136: Find the standard deviation of the
Q137: Provide an appropriate response.
-A bag contains
Q139: Find the specified probability distribution of
Q140: If the random variable X has a
Q141: Find the expected value of the random
Q142: Obtain the probability distribution of the
Q143: Calculate the specified probability
-Suppose that
Unlock this Answer For Free Now!
View this answer and more for free by performing one of the following actions

Scan the QR code to install the App and get 2 free unlocks

Unlock quizzes for free by uploading documents