Use the graph to answer the question.
-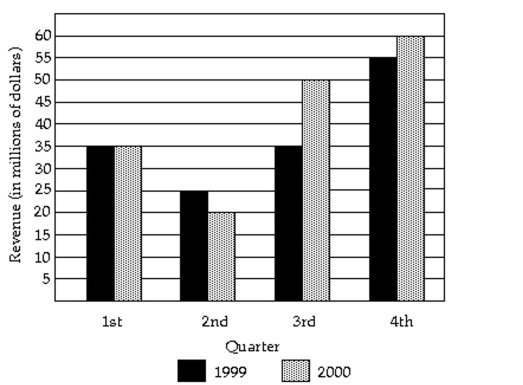
What was the revenue for the first quarter of 2000 ?
A) million
B) million
C) million
D) million
Correct Answer:
Verified
Q128: Solve the problem.
-For the study described below,
Q129: The stack plot below shows the value
Q130: State whether the scatter diagram shows strong
Q131: Use the graph to answer the question.
-
Q132: Construct a line chart for the
Q134: Construct a line chart for the
Q135: A sample statistic and margin of
Q136: State whether you think that the variables
Q137: Identify which of these types of sampling
Q138: Solve the problem.
-For the study described below,
Unlock this Answer For Free Now!
View this answer and more for free by performing one of the following actions

Scan the QR code to install the App and get 2 free unlocks

Unlock quizzes for free by uploading documents