Make a Scatter Diagram for the Data Plot Unemployment Rate on the Horizontal Axis and Median Rental
Make a scatter diagram for the data.
-The table shows the unemployment rate and the median price of renting an apartment in nine cities. Plot unemployment rate on the horizontal axis and median rental price on the vertical axis. 
A) 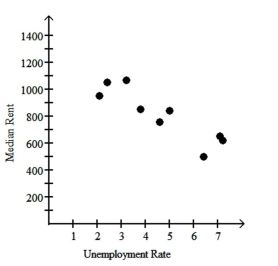
B) 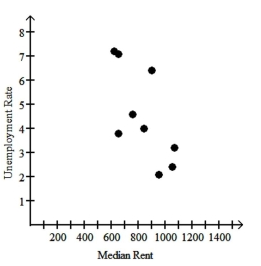
C) 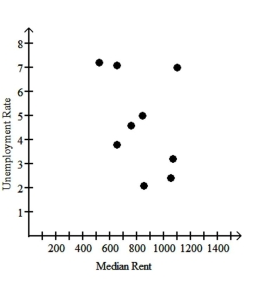
D) 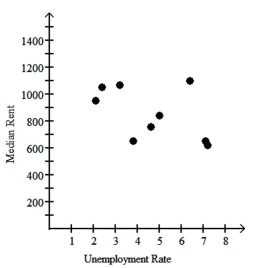
Correct Answer:
Verified
Q122: Identify the variable as either qualitative
Q123: Determine whether the study involves selection bias,
Q124: A sample statistic and margin of
Q125: Solve the problem.
-For the study described below,
Q126: Use the graph to answer the question.
-
Q128: Solve the problem.
-For the study described below,
Q129: The stack plot below shows the value
Q130: State whether the scatter diagram shows strong
Q131: Use the graph to answer the question.
-
Q132: Construct a line chart for the
Unlock this Answer For Free Now!
View this answer and more for free by performing one of the following actions

Scan the QR code to install the App and get 2 free unlocks

Unlock quizzes for free by uploading documents