Use the graph to answer the question.
-The following chart shows the percentage of cigarette smokers in Gotham City. 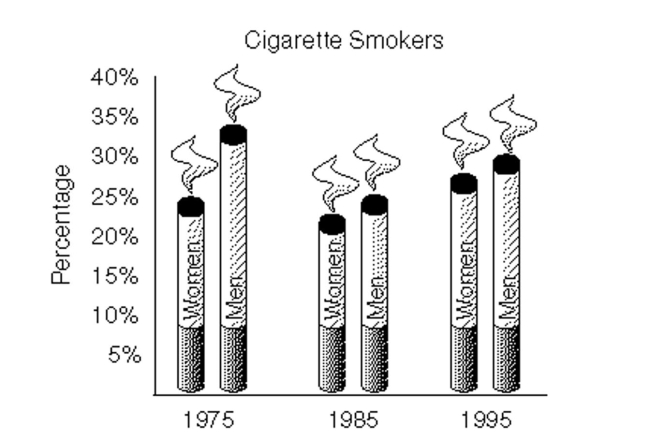 In which year does the percentage of men who smoke exceed the percentage of women who smoke by roughly 9 percentage points.
A) None of the above
B) 1975
C) 1995
D) 1985
Correct Answer:
Verified
Q103: Answer the question.
-The graph below shows
Q104: Provide an appropriate response.
-Suppose that you
Q105: Make a bar graph to represent
Q106: Use the guidelines to evaluate the study.
Q107: Make a bar graph to represent
Q109: Create a graphical display for the
Q110: Provide an appropriate response.
-Suppose that you
Q111: Use the graph to answer the question.
-This
Q112: State whether you think that the variables
Q113: Create a graphical display for the
Unlock this Answer For Free Now!
View this answer and more for free by performing one of the following actions

Scan the QR code to install the App and get 2 free unlocks

Unlock quizzes for free by uploading documents