Use this graph to answer the question. 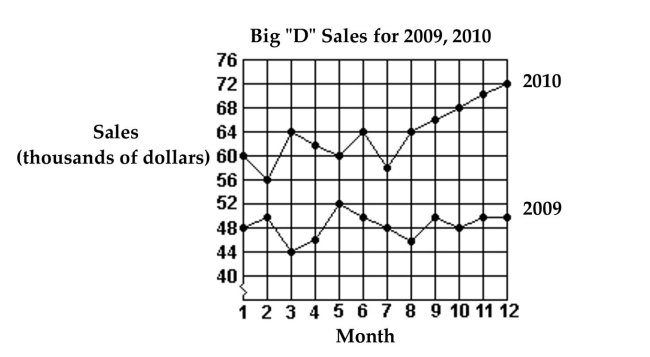
-What were the total sales for 2010?
A) $60,000
B) $578,000
C) $764,000
D) $72,000
Correct Answer:
Verified
Q3: Use this graph to answer the question.
Q28: Use this graph to answer the question.
Q29: Answer the question.
-The bar graph below shows
Q30: Use this graph to answer the question.
Q31: Answer the question.
-The bar graph below shows
Q32: This double-bar graph shows the number of
Q34: Answer the question.
-The bar graph below shows
Q36: Use this graph to answer the question.
Q37: Answer the question.
-The bar graph below shows
Q38: Use this graph to answer the question.
Unlock this Answer For Free Now!
View this answer and more for free by performing one of the following actions

Scan the QR code to install the App and get 2 free unlocks

Unlock quizzes for free by uploading documents