Use this graph to answer the question. 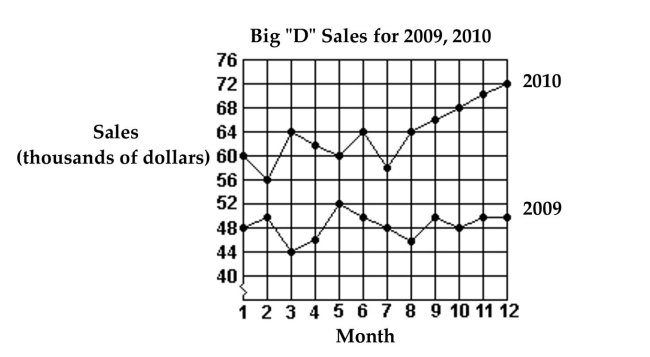
-What were the total sales for the first 6 months of 2010?
A) $366,000
B) $286,000
C) $64,000
D) $302,000
Correct Answer:
Verified
Q18: Construct a stem and leaf display
Q19: Construct a frequency polygon.
-
Q20: Construct the specified histogram.
-The frequency table
Q21: Answer the question.
-The bar graph below shows
Q22: Use this graph to answer the question.
Q24: This double-bar graph shows the number of
Q25: Use this graph to answer the question.
Q26: Answer the question.
-The bar graph below
Q27: Construct a stem and leaf display
Q28: Use this graph to answer the question.
Unlock this Answer For Free Now!
View this answer and more for free by performing one of the following actions

Scan the QR code to install the App and get 2 free unlocks

Unlock quizzes for free by uploading documents