Use the graph of population change per year for a metro area to answer the question. 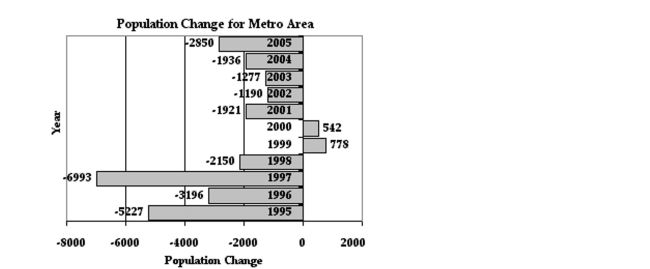
-In which year did the population of the metro area decrease the most?
A) 2005
B) 1995
C) 2000
D) 1997
Correct Answer:
Verified
Q28: Use the graph of population change per
Q29: Use an integer to express the number.
-Mr.
Q30: Graph the numbers on a number
Q31: Give the opposite and then the absolute
Q32: Use an integer to express the number.
-This
Q34: Select the smaller of the two
Q35: Graph the numbers on a number line.
--10,
Q36: Give the opposite and then the absolute
Q37: Graph the numbers on a number line.
--6,
Q38: Give the opposite and then the absolute
Unlock this Answer For Free Now!
View this answer and more for free by performing one of the following actions

Scan the QR code to install the App and get 2 free unlocks

Unlock quizzes for free by uploading documents