Use the figure to answer the question.
-The weights (in pounds) of a group of high school students are listed below in a stem-and-leaf plot. 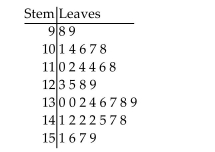 Which interval has the most students in it?
A) 130-139
B) 110-119
C) 140-149
D) 90-99
Correct Answer:
Verified
Q10: Use the statistical display to answer the
Q11: Use the statistical display to answer the
Q12: Construct the requested statistical display.
-The mileage
Q13: Use the statistical display to answer
Q14: Construct the requested statistical display.
-The attendance
Q16: Use the statistical display to answer the
Q17: Use the figure to answer the question.
-The
Q18: Use the figure to answer the question.
-The
Q19: Use the statistical display to answer the
Q20: Use the statistical display to answer the
Unlock this Answer For Free Now!
View this answer and more for free by performing one of the following actions

Scan the QR code to install the App and get 2 free unlocks

Unlock quizzes for free by uploading documents