The line graph shows the recorded hourly temperatures in degrees Fahrenheit at an airport. 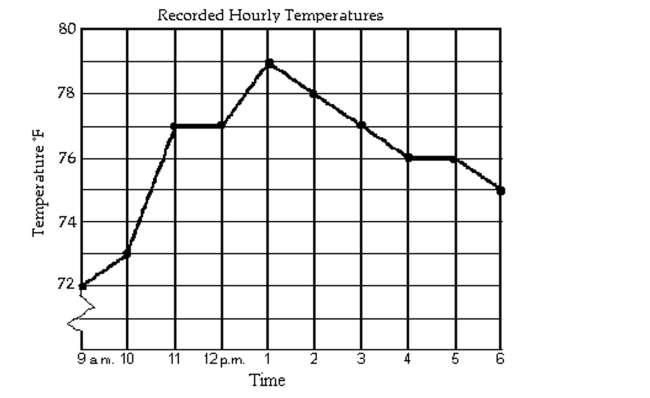
-At what time was the temperature its lowest?
A) 4 p.m.
B) 9 a.m.
C) 1 p.m.
D) 6 p.m.
Correct Answer:
Verified
Q177: The graph of y = f(x)
Q178: The graph of y = f(x)
Q179: Give the domain and range of
Q180: The graph of y = f(x)
Q181: The line graph shows the recorded hourly
Q183: Match the description with the correct
Q184: Determine the largest open intervals of
Q185: Use the graph to solve the
Q186: Determine the largest open intervals of
Q187: The line graph shows the recorded hourly
Unlock this Answer For Free Now!
View this answer and more for free by performing one of the following actions

Scan the QR code to install the App and get 2 free unlocks

Unlock quizzes for free by uploading documents