The following graph shows the populations of the metropolitan areas of City X and City Y over six years. 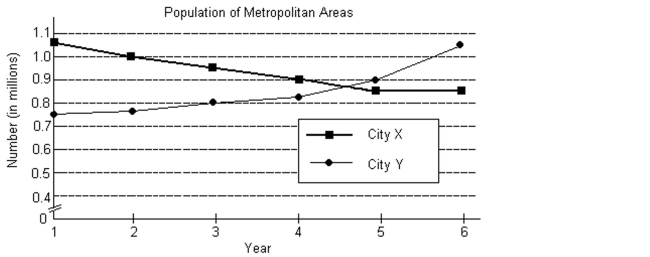
-In what years was the population of the City X metropolitan area less than that of the City Y metropolitan area?
A) Years 5-6
B) Years
C) Years 3-5
D) Years
Correct Answer:
Verified
Q1: Solve the system by elimination.
7x +
Q3: Solve the system by elimination.
6x +
Q4: Solve the system by elimination.
-
Q5: Solve the system by substitution.
-
Q6: Solve the system by elimination.
-
Q7: Solve the system by elimination.
-6x -
Q8: Solve the system by substitution.
-
Q9: The following graph shows the populations of
Q10: Solve the system by elimination.
-
Q11: Solve the system by substitution.
-2x =
Unlock this Answer For Free Now!
View this answer and more for free by performing one of the following actions

Scan the QR code to install the App and get 2 free unlocks

Unlock quizzes for free by uploading documents