SCENARIO 2-16
The figure below is the percentage polygon for the amount of calories for a sample of 36 pizzas
products where the upper limits of the intervals are: 310, 340, 370, 400 and 430. 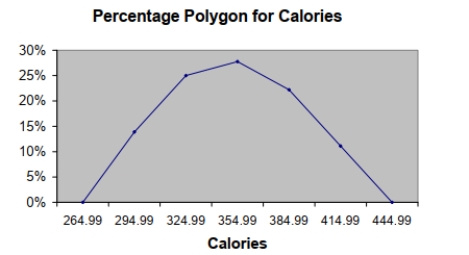
-Referring to Scenario 2-16, roughlyCalories what percentage of pizza products contains between 400 and 430 calories?
A) 0%
B) 11%
C) 89%
D) 100%
Correct Answer:
Verified
Q146: SCENARIO 2-17
The following table presents total retail
Q162: SCENARIO 2-18
The stem-and-leaf display below shows the
Q168: SCENARIO 2-18
The stem-and-leaf display below shows the
Q171: SCENARIO 2-18
The stem-and-leaf display below shows the
Q179: The Guidelines for Developing Visualizations recommend labeling
Q181: SCENARIO 2-15 The figure below is the
Q182: SCENARIO 2-16 The figure below is the
Q193: Given below is the scatter plot of
Q202: SCENARIO 2-19-A
You are the quality control
Q203: SCENARIO 2-19-A
You are the quality control
Unlock this Answer For Free Now!
View this answer and more for free by performing one of the following actions

Scan the QR code to install the App and get 2 free unlocks

Unlock quizzes for free by uploading documents