Determine if a display of data is appropriate.
-The following bar chart summarizing consumer preferences for various brands of
Digital cameras shows 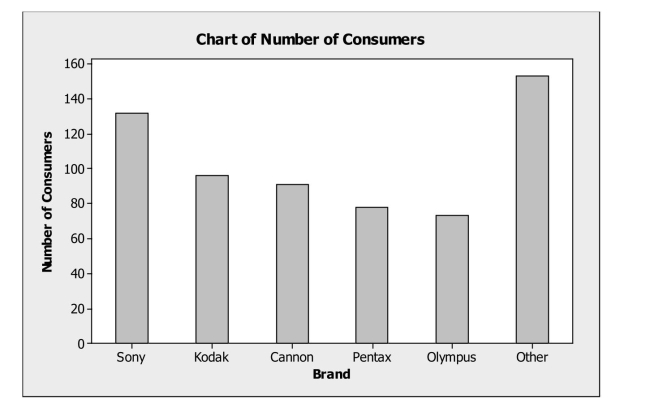
A) the marginal distribution of brands.
B) the conditional distribution of brands.
C) the contingency distribution of brands.
D) the distribution for a quantitative variable.
E) none of the above.
Correct Answer:
Verified
Q11: Interpret summary statistics.
-Find each of the following
Q12: Find conditional and marginal distributions.
-A full
Q13: Examine a contingency table.
-A large national
Q14: Find conditional and marginal distributions.
-A large national
Q16: Determine if a display of data is
Q17: Create and analyze relative frequency distributions.
-A
Q18: Find conditional and marginal distributions.
-A regional
Q20: Determine if a display of data is
Q21: Find conditional and marginal distributions.
-A regional
Q61: A research company frequently monitors trends
Unlock this Answer For Free Now!
View this answer and more for free by performing one of the following actions

Scan the QR code to install the App and get 2 free unlocks

Unlock quizzes for free by uploading documents