Analyze scatterplots and correlation coefficients.
-A small independent organic food store offers a variety of specialty coffees. To
Determine whether price has an impact on sales, the managers kept track of how many
Pounds of each variety of coffee were sold last month. Based on the scatterplot, the
Linear relationship between number of pounds of coffee sold per week and price is 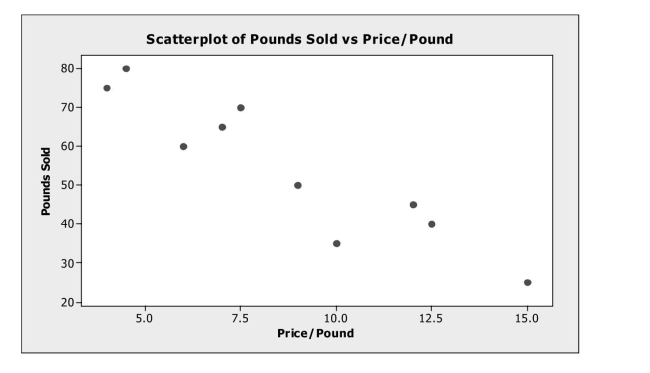
A) strong and positive.
B) strong and negative.
C) weak and negative.
D) weak and positive.
E) nonexistent.
Correct Answer:
Verified
Q23: Analyze scatterplots and correlation coefficients.
-For the scatterplot
Q24: Interpret a linear regression equation and use
Q25: Interpret the value of correlation coefficients
Q26: Interpret the value of correlation coefficients
Q27: Understand the relationship between the correlation and
Q29: Analyze scatterplots and correlation coefficients.
-A consumer research
Q30: Analyze residuals.
-Based on the following residual plot,
Q31: Interpret a linear regression equation and use
Q32: Write and interpret a linear regression
Q33: Interpret a linear regression equation and use
Unlock this Answer For Free Now!
View this answer and more for free by performing one of the following actions

Scan the QR code to install the App and get 2 free unlocks

Unlock quizzes for free by uploading documents