Given functions f and g, perform the indicated operations.
-The following graph shows the private, public and total national school enrollment for students for select years from 1970 through 2000 .
National School Enrollment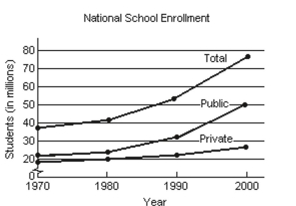
i) How is the graph for total school enrollment, T, determined from the graph of the private enrollment, , and the public enrollment, u?
ii) During which 10 -year period did the total number of students enrolled increase the least?
iii) During which 10 -year period did the total number of students enrolled increase the most?
A) i) is the sum of and .
ii)
iii)
B) i) is the sum of and
ii)
iii)
C) i) is the sum of and .
ii)
iii)
D) i) is the difference of and .
ii)
iii)
Correct Answer:
Verified
Q261: Given functions f and g, perform
Q262: Given functions f and g, perform
Q263: Given functions f and g, perform
Q264: Given functions f and g, perform
Q265: For the given functions f and
Q267: Given functions f and g, perform
Q268: Find the domain of the function.
-
Q269: Given functions f and g, perform
Q270: Given functions f and g, perform
Q271: Find the domain of the function.
-
Unlock this Answer For Free Now!
View this answer and more for free by performing one of the following actions

Scan the QR code to install the App and get 2 free unlocks

Unlock quizzes for free by uploading documents