The following graph shows data for a recent train ride from New York to Toronto. At what rate did the train travel? 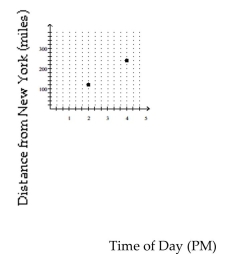
A) 60 miles per hour
B) 50 miles per hour
C) 120 miles per hour
D) 65 miles per hour
Correct Answer:
Verified
Q283: A gas station sells 4820 gallons of
Q284: Provide an appropriate response.
-Explain the process used
Q285: A deep sea diving bell is being
Q286: A cable TV company charges
Q287: In 2012, a certain country recovered
Q289: The forearm length in centimeters, A,
Q290: The rate of return of certain investments
Q291: Using a phone card to make a
Q292: A gas station sells 4820 gallons of
Q293: Persons taking a 30-hour review course to
Unlock this Answer For Free Now!
View this answer and more for free by performing one of the following actions

Scan the QR code to install the App and get 2 free unlocks

Unlock quizzes for free by uploading documents