The following graph shows the stock price of a new internet company over the first 18 months after the initial public offering of its stock. 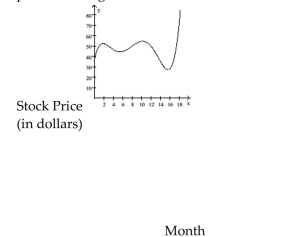 Approximately in which month(s) did the stock price reach $70?
A) The 18th month
B) The 10th and 18th months
C) The 2nd and 10th months
D) The price never reached $70.
Correct Answer:
Verified
Q93: The population of rabbits varies with the
Q94: The population of rabbits varies with the
Q95: Crafty Bill's Cool Car Sales opened as
Q96: A box is to be made
Q97: The following graph shows the stock price
Q99: The population of a formerly endangered mouse
Q100: This chart shows the fees for
Q101: Graph the function with a graphing
Q102: Provide an appropriate response.
-If the ordered
Q103: Graph the function with a graphing
Unlock this Answer For Free Now!
View this answer and more for free by performing one of the following actions

Scan the QR code to install the App and get 2 free unlocks

Unlock quizzes for free by uploading documents