The average number of prisoners in a county jail is modeled by y , where x is the number of years after 2000.
1. Graph this function from 0 to 30.
2. Approximate, to the nearest whole number, how many prisoners there will be in 2010.
3. Does this model indicate that the number of prisoners will increase or decrease from 2000 to 2030?
A) 1.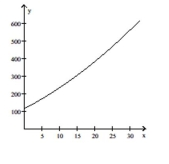
2. 233
3. increase
B) 1.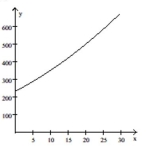
2. 351
3. increase
C) 1.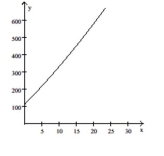
2. 233
3. increase
D) 1.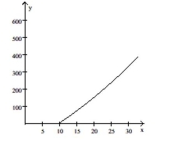
2. 333
3. increase
Correct Answer:
Verified
Q67: Use factoring to solve the equation
-
Q68: If a ball is thrown upward
Q69: Use factoring to solve the equation
-
Q70: Use a graphing utility to find
Q71: Use factoring to solve the equation
-
Q73: Use factoring to solve the equation
-
Q74: Use factoring to solve the equation
-
Q75: Use factoring to solve the equation
-
Q76: Use a graphing utility to find
Q77: Use factoring to solve the equation
-
Unlock this Answer For Free Now!
View this answer and more for free by performing one of the following actions

Scan the QR code to install the App and get 2 free unlocks

Unlock quizzes for free by uploading documents