The bar graph below shows the political party affiliation of 1000 registered U.S. voters. What percentage of the1000 registered U.S. voters belonged to one of the traditional two parties (Democratic and Republican) ? 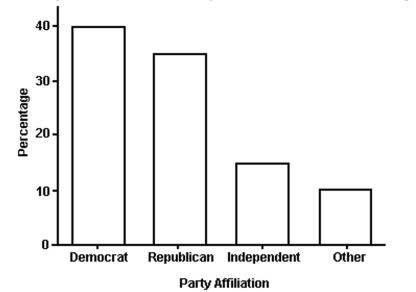
A) 75%
B) 40%
C) 35%
D) 25%
Correct Answer:
Verified
Q1: Student Council President Q2: The Excel frequency bar graph below describes Q3: Scott Tarnowski owns a pet grooming Q5: The results of a survey about Q6: The preschool children at Elmwood Elementary Q7: During which week was the fewest number Q8: The grade point averages for 40 Q9: The local police, using radar, checked Q10: True or False: Relative frequency is Q11: Approximately how many tickets were sold during![]()
Unlock this Answer For Free Now!
View this answer and more for free by performing one of the following actions

Scan the QR code to install the App and get 2 free unlocks

Unlock quizzes for free by uploading documents