A store manager counts the number of customers who make a purchase in his store each_ day. The data are as follows.
Which of these choices display the correct dotplot?
A) Number of Customers Per Day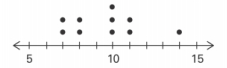
B) Number of Customers Per Day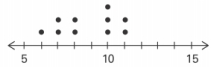
C) Number of Customers Per Day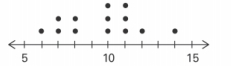
D) Number of Customers Per Day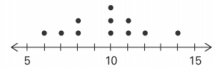
Correct Answer:
Verified
Q1: Analysis of the data from 25
Q2: Q4: The weights (in pounds)of 22 members Q5: A nurse measured the blood pressure Q6: The attendance counts for this season's Q7: The histogram below represents the number of Q7: The two key parts of a regression Q8: A nurse measured the blood pressure of Q9: The following frequency distribution represents the Q10: The frequency distribution below summarizes employee
Unlock this Answer For Free Now!
View this answer and more for free by performing one of the following actions

Scan the QR code to install the App and get 2 free unlocks

Unlock quizzes for free by uploading documents