Construct a boxplot for the given data. Include values of the 5-number summary in all_ boxplots. The test scores of 40 students are listed below.
A) 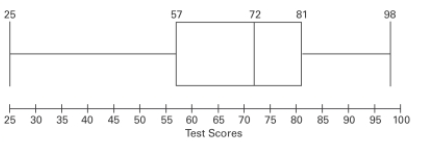
B) 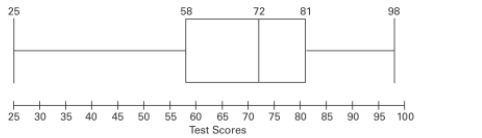
C) 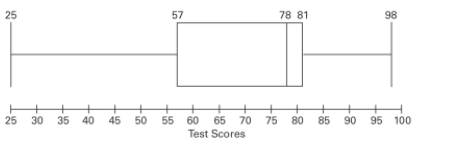
D) 
Correct Answer:
Verified
Q1: A store manager kept track of
Q2: The customer service department of a
Q3: Find the standard deviation for the
Q5: A student earned grades of B, B,
Q7: The prices (in dollars)of 12 electric
Q8: The number of vehicles passing through
Q9: The test scores of 40 students
Q11: If the standard deviation for a set
Q11: Find the standard deviation for the
Q14: If your score on your next statistics
Unlock this Answer For Free Now!
View this answer and more for free by performing one of the following actions

Scan the QR code to install the App and get 2 free unlocks

Unlock quizzes for free by uploading documents