A control chart for R is shown below. Determine whether the process variation is within_
statistical control. If it is not, identify which of the three out-of-control criteria lead to rejection
of statistically stable variation. 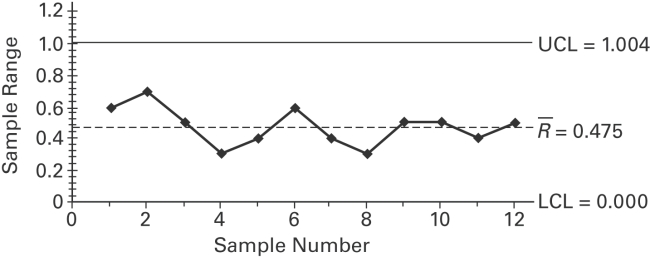
Correct Answer:
Verified
View Answer
Unlock this answer now
Get Access to more Verified Answers free of charge
Q5: Construct an Q6: Construct an R chart and determine Q6: Define statistically stable (or "within statistical control"). Q10: Describe the three criteria used to determine Q10: A control chart for Q11: Examine the given run chart or control Q13: Provide an appropriate response. Describe what process Q13: A control chart for Q15: Sketch a control chart that indicates that Q18: Describe a run chart and give an
Unlock this Answer For Free Now!
View this answer and more for free by performing one of the following actions

Scan the QR code to install the App and get 2 free unlocks

Unlock quizzes for free by uploading documents