Related Questions
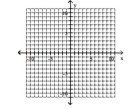
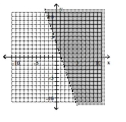
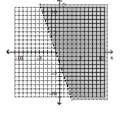
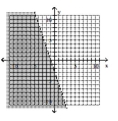
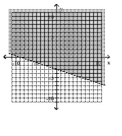
Q182: Graph the inequality. Q183: Graph the inequality. Q184: Graph the inequality. Q185: Graph the inequality. Q186: Graph the inequality. Q188: Graph the inequality. Q189: Graph the inequality. Q190: Graph the inequality. Q191: Graph the inequality. Q192: Solve. Unlock this Answer For Free Now! View this answer and more for free by performing one of the following actions Scan the QR code to install the App and get 2 free unlocks Unlock quizzes for free by uploading documents
-
-
-
-
-
-
-
-
-
hat
-In 1995 , the average annual
