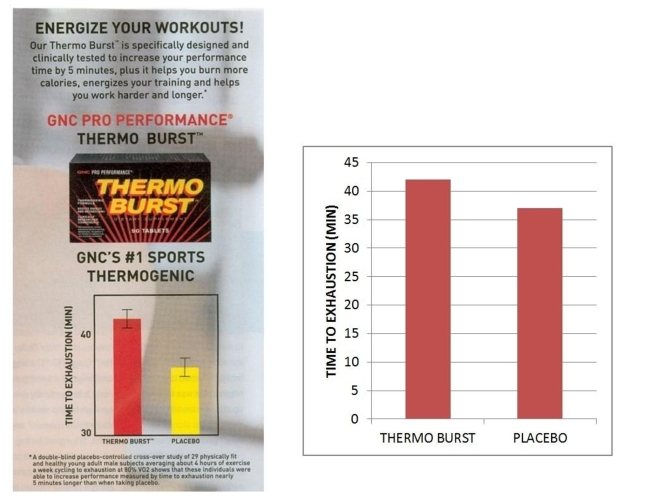
Consider this bar graph found in an advertisement for a performance supplement. Compare it to the
second bar graph, which represents the same data.  a. Estimate the average time to exhaustion using Thermo Burst.
b. Estimate the average time to exhaustion for those taking the placebo.
c. Why do the graphs look so different? Explain how the graph on the left might be used to mislead the reader.
Correct Answer:
Verified
b. About 37 minutes
...
View Answer
Unlock this answer now
Get Access to more Verified Answers free of charge
Q308: Charles wants to take out a 5
Q309: I want to find the area of
Q310: Use the conversions sheet to help you
Q311: Use the conversions sheet to help you
Q312: At midnight the temperature was -8°F. By
Q313: Of all the topics we have covered
Q314: A student is living on a budget
Q316: Use the protractor to find 
Q317: Use the conversions sheet to help you
Q318: Diabetics need to keep close watch on
Unlock this Answer For Free Now!
View this answer and more for free by performing one of the following actions

Scan the QR code to install the App and get 2 free unlocks

Unlock quizzes for free by uploading documents