The figure represents the results of a survey on favorite foods. 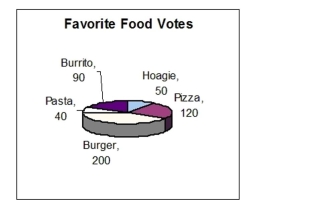 Compare the number of votes for burgers and hoagies.
A) There were 4 times as many votes for burgers as for hoagies.
B) There were 4.5 times as many votes for burgers as for hoagies.
C) There were 3 times as many votes for burgers as for hoagies.
D) There were 3.5 times as many votes for burgers as for hoagies.
Correct Answer:
Verified
Q11: The figure represents the results of a
Q12: For the English sentence below, write a
Q13: Convert the unit of capacity. 
Q14: Convert the units of length using unit
Q15: Multiply and write the answer as a
Q17: A drill with an original price of
Unlock this Answer For Free Now!
View this answer and more for free by performing one of the following actions

Scan the QR code to install the App and get 2 free unlocks

Unlock quizzes for free by uploading documents