The following figure is a probability density curve that represents the lifetime, in months, of a certain type of laptop battery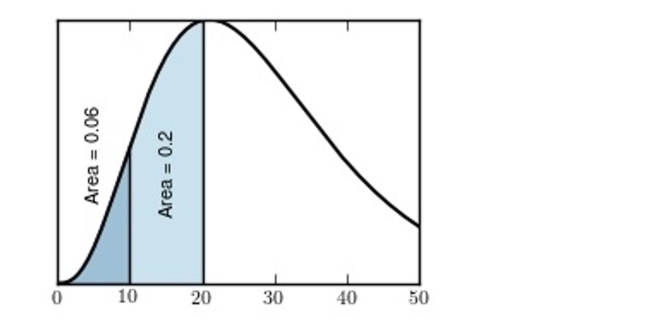
Find the proportion of batteries with lifetimes between 10 and 20 months
A) 0.74
B) 0.06
C) 0.26
D) 0.20
Correct Answer:
Verified
Q2: Find the z-scores that bound the middle
Q3: Find Q4: The following figure is a probability density Q5: Find the shaded area under the standard Q6: A normal population has a mean Q8: Find the area under the standard Q9: Find the area under the standard Q10: Find the z-score for which the area Q11: Find the z-score for which the area Q12: Find the area under the standard normal
Unlock this Answer For Free Now!
View this answer and more for free by performing one of the following actions

Scan the QR code to install the App and get 2 free unlocks

Unlock quizzes for free by uploading documents