A normal quartile plot is given below for the weekly incomes (in dollars)of a sample of engineers in one town. Describe what each x value represents and what each y value
represents. Use the plot to assess the normality of the incomes of engineers in this town.
Explain your reasoning. 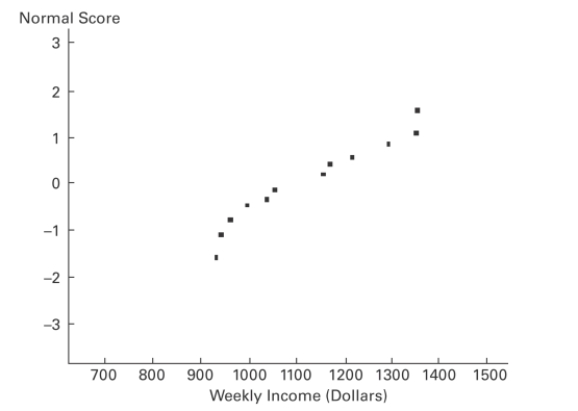
Correct Answer:
Verified
View Answer
Unlock this answer now
Get Access to more Verified Answers free of charge
Q48: Three randomly selected households are surveyed as
Q49: You will use a normal distribution
Q50: Suppose that you wish to find
Q51: Describe what an unbiased estimator is and
Q52: SAT verbal scores are normally distributed with
Q54: In a recent year, the U.S. Mint
Q55: Explain how a nonstandard normal distribution differs
Q56: Identify three important criteria to determine if
Q57: State the central limit theorem. Describe the
Q58: Define the central limit theorem and its
Unlock this Answer For Free Now!
View this answer and more for free by performing one of the following actions

Scan the QR code to install the App and get 2 free unlocks

Unlock quizzes for free by uploading documents