Solve.
-Suppose that a polynomial function is used to model the data shown in the graph below. 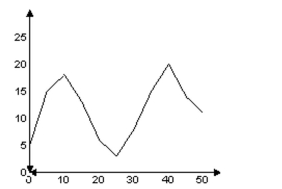
For what intervals is the function increasing?
A) 10 through 25 and 40 through 50
B) 0 through 40
C) 0 through 10 and 20 through 50
D) 0 through 10 and 25 through 40
Correct Answer:
Verified
Q211: Determine the maximum possible number of
Q212: Determine the maximum possible number of
Q213: Use the Intermediate Value Theorem to
Q214: Determine the maximum possible number of
Q215: Use the Intermediate Value Theorem to
Q217: Determine the maximum possible number of
Q218: Determine the maximum possible number of
Q219: Solve.
-Suppose that a polynomial function is used
Q220: Use the Intermediate Value Theorem to
Q221: Solve.
-The profits (in millions)for a company
Unlock this Answer For Free Now!
View this answer and more for free by performing one of the following actions

Scan the QR code to install the App and get 2 free unlocks

Unlock quizzes for free by uploading documents