Use the scatter diagrams to verify which statements are correct:
Chart A 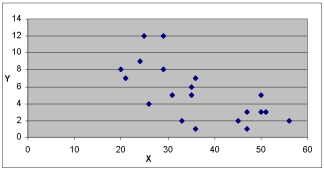
Chart B 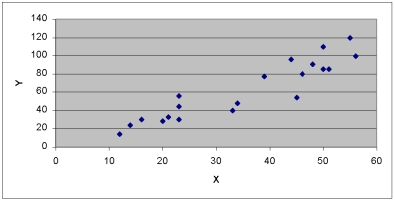
Chart C 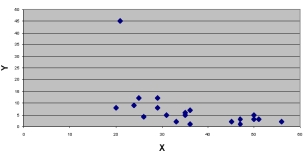
A) The variables in Chart A have a positive correlation
B) The variables in Chart B have a positive correlation
C) The variables in Chart B have a negative correlation
D) The variables in Chart A have a stronger correlation than the variables in Chart B
E) B & D are correct
Correct Answer:
Verified
Q94: The correlation between two variables is -0.63
Q95: What is the measure that indicates how
Q96: Which value of r indicates a stronger
Q97: Which of the following is true about
Q98: The correlation between two variables is -0.63
Q100: The partial megastat output below is regression
Q101: A sales manager for an advertising agency
Q102: Which of the following is NOT a
Q104: The correlation between two variables is 0.29
Q150: A regression analysis yields the following information:
Y'
Unlock this Answer For Free Now!
View this answer and more for free by performing one of the following actions

Scan the QR code to install the App and get 2 free unlocks

Unlock quizzes for free by uploading documents