Multiple Choice
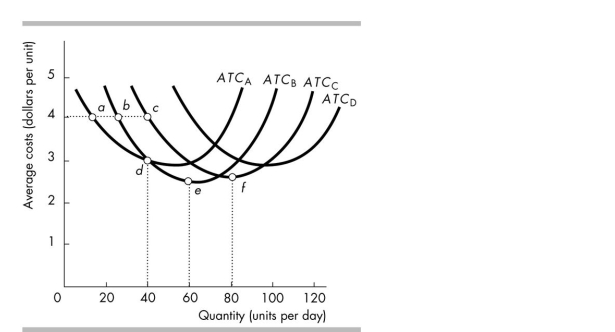
-The average total cost curves for plants A, B, C and D are shown in the above figure. It is possible that the long- run average cost curve runs through points
A) d, e and f.
B) b, d and e.
C) a, b and c.
D) c and d.
Correct Answer:
Verified
Related Questions
Q77: If the average total cost of producing
Q78: Sheila's Sports Shop is a very popular
Q79: An electrician quits her current job, which
Q80: A firm's long- run cost is the
Q81: The marginal product and average product curves
A)
Unlock this Answer For Free Now!
View this answer and more for free by performing one of the following actions

Scan the QR code to install the App and get 2 free unlocks

Unlock quizzes for free by uploading documents