Figure 5-7
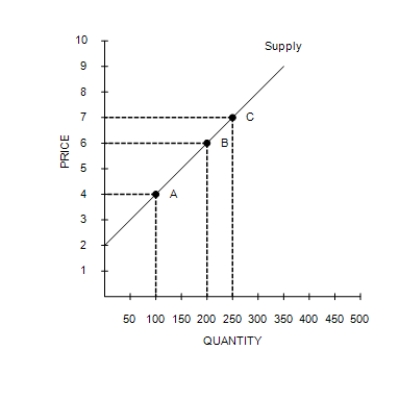
-Refer to Figure 5-7. Using the midpoint method, what is the price elasticity of supply between point B and point C?
A) 1.44
B) 1.29
C) 0.96
D) 0.69
Correct Answer:
Verified
Q201: Suppose researchers at the University of Wisconsin
Q202: Table 5-4 Q203: Which of the following statements is not Q204: A manufacturer produces 410 units when the Q205: In January, the price of dark chocolate Q207: Scenario 5-2 Q208: A decrease in supply will cause the Q209: Figure 5-7 Q210: Scenario 5-2 Q211: Figure 5-6 Unlock this Answer For Free Now! View this answer and more for free by performing one of the following actions Scan the QR code to install the App and get 2 free unlocks Unlock quizzes for free by uploading documents
![]()
Milk has an inelastic demand, and
![]()
Milk has an inelastic demand, and
![]()

