Which is true for the data shown in the histogram?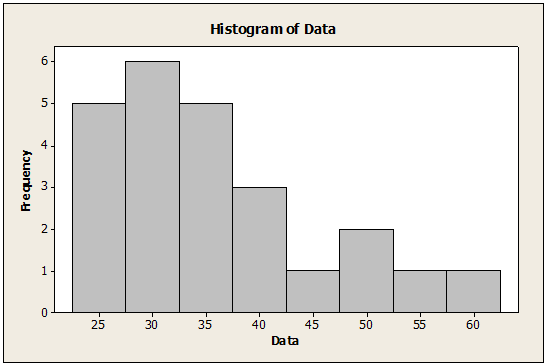
I.The distribution is skewed to the right.
II.The mean is probably smaller than the median.
III.It is appropriate to summarize these data with the mean and standard deviation.
A) I only
B) II only
C) I and II
D) I and III
E) I, II and III
Correct Answer:
Verified
Q90: A customer service center keeps track of
Q91: Boxplots of earnings per share (EPS) data
Q92: A customer service center keeps track of
Q93: What scale of measurement is the type
Q94: For families who live in apartments the
Q96: The following scatterplot shows monthly sales figures
Q97: A business researcher conducted a survey of
Q98: A government agency has 6000 employees.As an
Q99: Suppose a sample of 60 cans of
Q100: Real estate agencies keep track of housing
Unlock this Answer For Free Now!
View this answer and more for free by performing one of the following actions

Scan the QR code to install the App and get 2 free unlocks

Unlock quizzes for free by uploading documents