The frequency distribution shown summarizes data on the percentage of college students enrolled in public institutions for the 50 U.S. states. 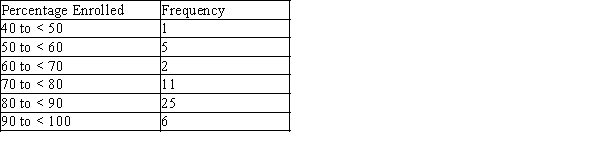 What is the relative frequency for the 70 to < 80 interval?
A) 0.05
B) 0.10
C) 0.22
D) 11
E) 50
Correct Answer:
Verified
Q6: Frequency distributions can only be used with
Q8: The relative frequency for a particular category
Q9: An outlier is an unusually small or
Q20: The density of a class can be
Q21: A statewide survey released by the University
Q23: Bat characteristics
Biologists know that bats have different
Q24: The annual household incomes, in thousands of
Q25: The annual household incomes, in thousands of
Q26: Ruminants are hoofed animals such as cattle
Q27: The cumulative relative frequency plot shown was
Unlock this Answer For Free Now!
View this answer and more for free by performing one of the following actions

Scan the QR code to install the App and get 2 free unlocks

Unlock quizzes for free by uploading documents