The following relative frequency distribution summarizes student responses to the question "If you could make your college choice over, would you still choose to enroll at your current college?"  Which of the following is the correct bar chart for the response data?
A) 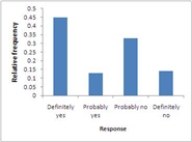
B) 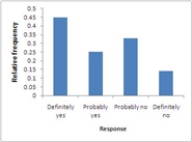
C) 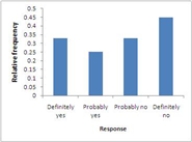
D) 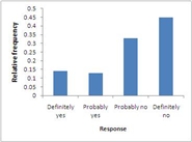
E) 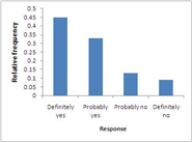
Correct Answer:
Verified
Q4: A data set is multivariate if it
Q5: A survey form solicited the following responses:
Q8: If the upper tail of a distribution
Q12: A pie chart is most useful for
Q12: A survey asked adult respondents how dependent
Q13: Which of the following variables are discrete?
Q15: A data set is discrete if the
Q16: In a scatter plot, both the horizontal
Q17: For stem and leaf plots with single-digit
Q18: A curve with tails that decline more
Unlock this Answer For Free Now!
View this answer and more for free by performing one of the following actions

Scan the QR code to install the App and get 2 free unlocks

Unlock quizzes for free by uploading documents