The data in the table below are the changes in the amount of space available to standing passengers at the 19 stops between 1987 and 1988. 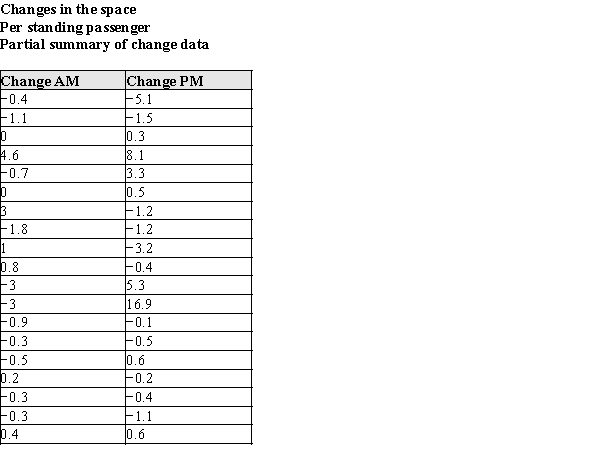 In the table below, summary information is presented for these data.

(a)Using the raw data and summary information presented in the tables above, construct box plots to compare the changes in available space the morning and afternoon. (Reminder: Don't forget to check for outliers!)(b)The Transit System wishes to know if their efforts to improve the standing space were successful. (Remember, more space is better!) Their engineers had suggested that the changes in the system would, on average, be more successful at increasing the available space in the morning than in the afternoon. Does the data support this initial belief? What specific aspects of the plot in part (a) support your answer?
(c)Using your box plots in part (a), write a short paragraph for the New York Times describing the success the Transit System had in increasing the available space per passenger. Note any differences in success between the morning rush and the afternoon rush.
Correct Answer:
Verified
View Answer
Unlock this answer now
Get Access to more Verified Answers free of charge
Q27: The National U.S. Bureau of Labor Statistics
Q28: Exhibit 3-1
In recent years there has been
Q29: The Territory of Iowa was initially surveyed
Q30: The data in the table below are
Q31: Exhibit 3-1
In recent years there has been
Q33: To compare the average weekly earnings of
Q34: In order to attribute changes in nest
Q35: Consider a study in which the heights
Q36: Which statistical parameters of the numerical data
Q37: Grey Kangaroos are large, social marsupials, indigenous
Unlock this Answer For Free Now!
View this answer and more for free by performing one of the following actions

Scan the QR code to install the App and get 2 free unlocks

Unlock quizzes for free by uploading documents