Suppose that the random variable  has the probability distribution described by the following density curve.
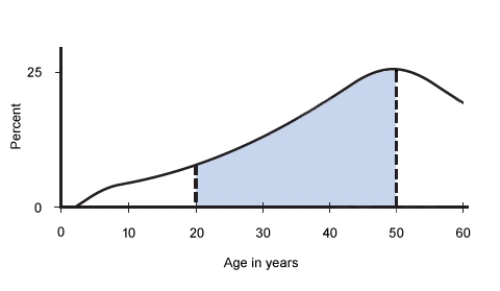
What probability is represented by the shaded area? Suppose the shaded area  . Interpret this probability in the context of this problem.
A)  .About 65% of U.S.population consuming diet drinks are people aged less than 20 years.
B)  .About 65% of U.S.population consuming diet drinks are people aged 50 years and over.
C)  .About 65% of U.S.population consuming diet drinks are people aged between 20 and 50 years.
D)  .About 0.65% of U.S.population consuming diet drinks are people aged between 20 and 50 years.
E)  .About 35% of U.S.population consuming diet drinks are people aged between 20 and 50 years.
Correct Answer:
Verified
Q25: Briefly describe how one would decide which
Q36: The time that it takes a randomly
Q37: When planning for the big Statistics Department
Q40: In a study of the reaction times
Q45: In a study of the reaction times
Q63: Seventy-five percent of the computers sold by
Q64: Suppose that in a certain metropolitan area
Q66: Ron rolls a six-sided dice until the
Q67: The graphs below are normal probability plots
Q70: Suppose that 73% of the visitors to
Unlock this Answer For Free Now!
View this answer and more for free by performing one of the following actions

Scan the QR code to install the App and get 2 free unlocks

Unlock quizzes for free by uploading documents