Given this multiple line chart, find the total number of cars recalled during these years. (All numbers plotted to nearest 5 units) 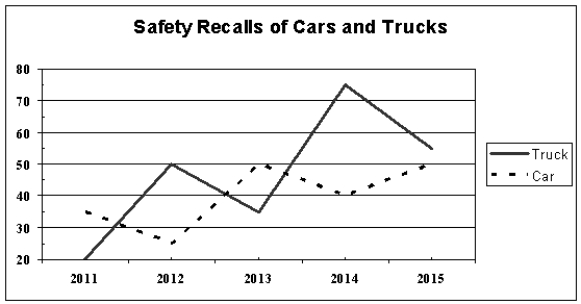
A) 150
B) 85
C) 345
D) 200
Correct Answer:
Verified
Q9: _ are a collection of related data
Q10: Use this component bar chart to find
Q11: Use this comparative bar chart to find
Q12: Given this multiple line chart, find the
Q13: What were the total sales of
Q15: A(n) _ is a special type of
Q16: _ represent quantities or percentages by the
Q17: How many sales calls were made
Q18: The _ is a circle divided into
Q19: The _ is the difference between the
Unlock this Answer For Free Now!
View this answer and more for free by performing one of the following actions

Scan the QR code to install the App and get 2 free unlocks

Unlock quizzes for free by uploading documents