Refer to the graph below. 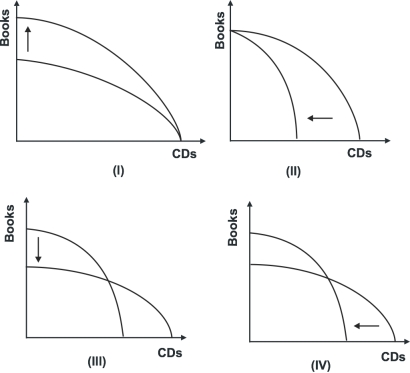 Which of the shifts explains what will happen to the production possibility curve if the cost of producing books goes down while the cost of producing CDs goes up?
A) I
B) II
C) III
D) IV
Correct Answer:
Verified
Q41: Refer to the graph below. 
Q42: Refer to the graph below.
Q44: The term efficiency involves achieving a goal
Q44: The graph below indicates that the economy
Q47: Refer to the graph shown.Destruction of some
Q49: Refer to the graph below.
Q51: A resource is said to have a
Q51: Refer to the graphs shown.The discovery of
Q52: According to Adam Smith, individuals are directed
Q66: The text attributes the growth of economies
Unlock this Answer For Free Now!
View this answer and more for free by performing one of the following actions

Scan the QR code to install the App and get 2 free unlocks

Unlock quizzes for free by uploading documents