Refer to the graph below. 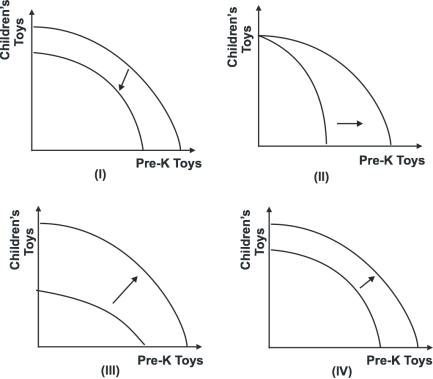 Which of the shifts explains what would happen to the production possibility curve if improved technologies increased the production of prekindergarten (Pre-K) toys by 25 percent and the production of children's toys by 50 percent?
A) I
B) II
C) III
D) IV
Correct Answer:
Verified
Q42: Laissez-faire is an economic:
A) theorem because it
Q49: If a country takes advantage of the
Q53: Refer to the graph below. 
Q54: Refer to the graph below.
Q55: If no resources had a comparative advantage
Q57: In election campaigns, presidents often promise more
Q59: Refer to the graph below.
Q61: The production possibility curves of two countries
Q64: John and Jane Smith are both economists
Q78: Up through the early decades of the
Unlock this Answer For Free Now!
View this answer and more for free by performing one of the following actions

Scan the QR code to install the App and get 2 free unlocks

Unlock quizzes for free by uploading documents