Refer to the graphs shown.Suppose the price of a good that is a substitute in both consumption and production for the good depicted in the graph falls.The expected shifts in supply and demand are shown in: 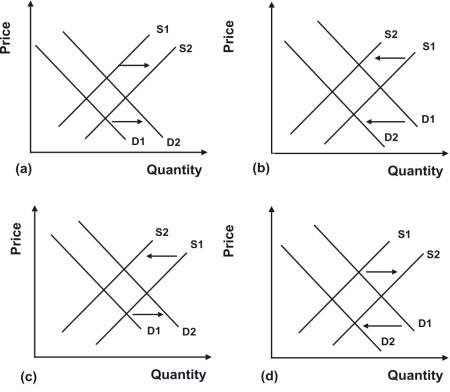
A) a.
B) b.
C) c.
D) d.
Correct Answer:
Verified
Q100: Suppose that the table shown shows the
Q102: If quantity supplied exceeds quantity demanded, there
Q102: Refer to the graphs shown.The relevant market
Q115: Using the supply and demand model, what
Q118: If you observe a market where quantity
Q120: When gasoline prices fall, the demand for
Q122: If both buyers and sellers expect the
Q125: If supply and demand both shift to
Q143: When airlines were deregulated, airfares declined by
Q147: How would a decline in demand for
Unlock this Answer For Free Now!
View this answer and more for free by performing one of the following actions

Scan the QR code to install the App and get 2 free unlocks

Unlock quizzes for free by uploading documents