Refer to the following graph. 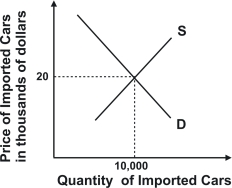 Suppose the graph depicted market demand for British cars sold in the United States.A tariff of $1,000 a car would result in tax revenue of:
A) $10 million.
B) less than $10 million.
C) greater than $10 million.
D) zero.
Correct Answer:
Verified
Q62: Tariffs can be thought of as indirect:
A)special
Q68: Refer to the graph shown.A quantity restriction
Q71: If the United States imposes tariffs on
Q72: When a country imposes a tariff:
A) the
Q72: Refer to the graph shown.Given the quantity
Q74: A tariff is:
A) a tax that government
Q84: Taxi medallions were issued in New York
Q96: If government were to issue a fixed
Q99: Quantity restrictions become more valuable to those
Q100: Quantity restrictions benefit which group the most?
A)
Unlock this Answer For Free Now!
View this answer and more for free by performing one of the following actions

Scan the QR code to install the App and get 2 free unlocks

Unlock quizzes for free by uploading documents