Given below is the scatter plot of the price/earnings ratio versus earnings per share of 20 U.S.companies.There appears to be a negative relationship between price/earnings ratio and earnings per share. 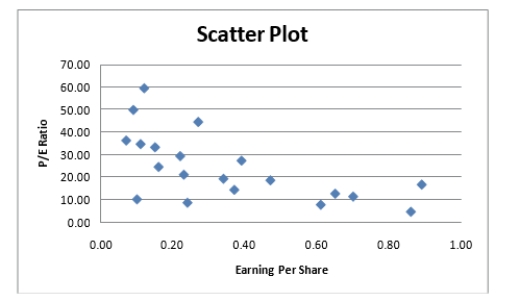
Correct Answer:
Verified
Q146: SCENARIO 2-17
The following table presents total retail
Q147: SCENARIO 2-17
The following table presents total retail
Q165: SCENARIO 2-17
The following table presents total retail
Q176: SCENARIO 2-18
The stem-and-leaf display below shows the
Q178: SCENARIO 2-18
The stem-and-leaf display below shows the
Q182: SCENARIO 2-16 The figure below is the
Q185: A multidimensional contingency table allows you to
Q196: Given below is the scatter plot of
Q204: The Best Practices for Creating Visual Summaries
Q211: The Best Practices for Creating Visual Summaries
Unlock this Answer For Free Now!
View this answer and more for free by performing one of the following actions

Scan the QR code to install the App and get 2 free unlocks

Unlock quizzes for free by uploading documents