The graph below represents the rate of change of a function f with respect to x; i.e., it is a graph of f'.You are told that f(0) = -2.For approximately what value of x other than x = 0 in the interval 0 x 2 does
= -2? 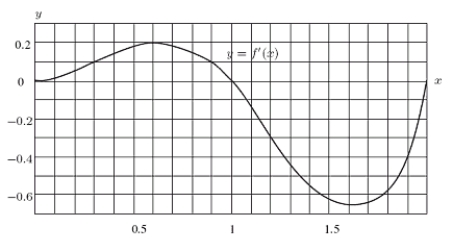
A) 0.6
B) 1
C) 1.4
D) 2
E) None of the above
Correct Answer:
Verified
Q48: Let t(h)be the temperature in degrees Celsius
Q49: On the axes below, sketch a smooth,
Q50: Every day the Office of Undergraduate
Q51: The cost in dollars to produce
Q52: Let t(h)be the temperature in degrees Celsius
Q54: A concert promoter estimates that the cost
Q55: Esther is a swimmer who prides
Q56: One of the following graphs is
Q57: Let t(h)be the temperature in degrees Celsius
Q58: A typhoon is a tropical cyclone, like
Unlock this Answer For Free Now!
View this answer and more for free by performing one of the following actions

Scan the QR code to install the App and get 2 free unlocks

Unlock quizzes for free by uploading documents