Services
Discover
Question 90
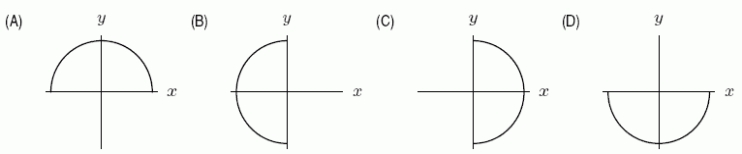
Which of the following diagrams represents the parametric curve x=−sint,y=cost,0≤t≤πx=-\sin t, y=\cos t, 0 \leq t \leq \pix=−sint,y=cost,0≤t≤π ?
Correct Answer:
Verified
Unlock this answer nowGet Access to more Verified Answers free of charge
Q85: A normal distribution in statistics is
Q86: Frank decided to ride in a hot
Q87: A lady bug moves on the
Q88: Find the limit:
Q89: The curve represented by the parametric
Q91: A lady bug moves on the
Q92: Motion of a particle is given
Q93: Determine the Q94: Determine the Q95: The equations Unlock this Answer For Free Now!View this answer and more for free by performing one of the following actionsScan the QR code to install the App and get 2 free unlocksMaximize QR codeUnlock quizzes for free by uploading documentsUpload documents
Q94: Determine the Q95: The equations
Q95: The equations
Unlock this Answer For Free Now!
View this answer and more for free by performing one of the following actions
Scan the QR code to install the App and get 2 free unlocks
Unlock quizzes for free by uploading documents