Below is the graph of the rate r at which people arrive for lunch at Cafeteria Charlotte.Checkers start at 12:00 noon and can pass people through at a constant rate of 5 people/minute.Let f(t)be the length of the line (i.e.the number of people)at time t.Suppose that at 11:50 there are already 150 people lined up.Using the graph together with this information, when is the line the longest? 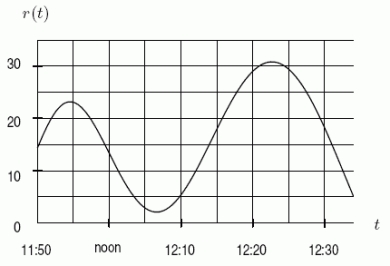
Correct Answer:
Verified
Q33: Below is the graph of the rate
Q34: Consider the function
Q35: Below is the graph of the rate
Q36: Consider the two-parameter family of curves
Q37: Consider the function
Q39: Consider the function
Q40: Graph the function
Q41: What does the Extreme Value Theorem allow
Q42: The revenue for selling q items
Q43: A single cell of a bee's
Unlock this Answer For Free Now!
View this answer and more for free by performing one of the following actions

Scan the QR code to install the App and get 2 free unlocks

Unlock quizzes for free by uploading documents