Essay
Below is the graph of the rate r at which people arrive for lunch at Cafeteria Charlotte.Checkers start at 12:00 noon and can pass people through at a constant rate of 5 people/minute.Let f(t)be the length of the line (i.e.the number of people)at time t.Suppose that at 11:50 there are already 150 people lined up.Using the graph together with this information, sketch a graph of f. 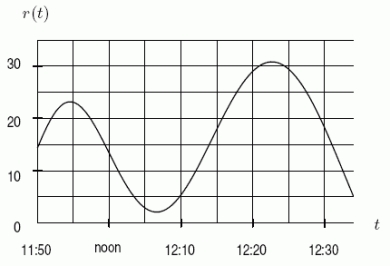
Correct Answer:
Verified
Related Questions
Unlock this Answer For Free Now!
View this answer and more for free by performing one of the following actions

Scan the QR code to install the App and get 2 free unlocks

Unlock quizzes for free by uploading documents