Multiple Choice
Figure 21-4
In each case, the budget constraint moves from BC-1 to BC-2. 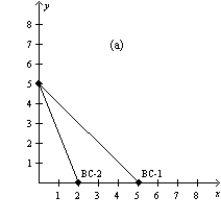
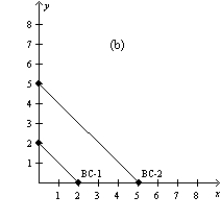
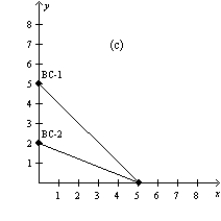
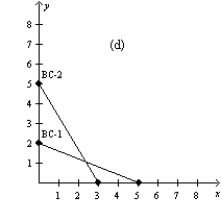
-Refer to Figure 21-4. Which of the graphs in the figure could reflect a decrease in income?
A) graph a
B) graph b
C) graph d
D) None of the above is correct.
Correct Answer:
Verified
Related Questions

