Figure 26-4. On the horizontal axis of the graph, L represents the quantity of loanable funds in billions of dollars. 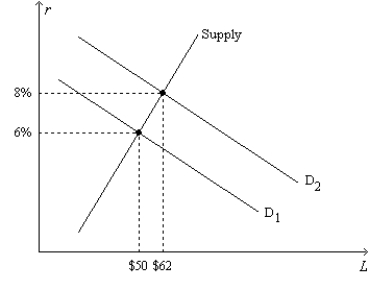
-Refer to Figure 26-4. Regard the position of the Supply curve as fixed, as on the graph. If the real interest rate is 8 percent, the inflation rate is 3 percent, and the market for loanable funds is in equilibrium, then the position of the demand-for-loanable-funds curve must be
A)  .
.
B)  .
.
C) between  and
and  .
.
D) to the right of  .
.
Correct Answer:
Verified
Q115: Figure 26-4.On the horizontal axis of the
Q119: Figure 26-4.On the horizontal axis of the
Q120: For an imaginary economy,when the real interest
Q129: Which of the following could explain a
Q131: We interpret the meaning of "loanable funds"
Q139: If the demand for loanable funds shifts
Q140: As real interest rates fall,firms desire to
A)buy
Q142: If the supply of and demand for
Q155: Figure 26-5.Figure 26-5 shows the loanable funds
Q158: Which of the following would shift the
Unlock this Answer For Free Now!
View this answer and more for free by performing one of the following actions

Scan the QR code to install the App and get 2 free unlocks

Unlock quizzes for free by uploading documents