Figure 27-5.The figure shows a utility function for Dexter. 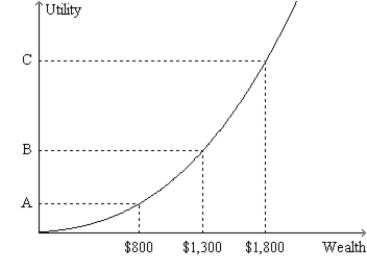
-Refer to Figure 27-5.From the appearance of the graph,we know that
A) Dexter's level of satisfaction increases by more when his wealth increases from $1,001 to $1,002 than it does when his wealth increases from $1,000 to $1,001.
B) Dexter's level of satisfaction increases by less when his wealth increases from $1,001 to $1,002 than it does when his wealth increases from $1,000 to $1,001.
C) Dexter's level of satisfaction increases by the same amount when his wealth increases from $1,001 to $1,002 as it does when his wealth increases from $1,000 to $1,001.
D) None of the above answers can be inferred from the appearance of the utility function.
Correct Answer:
Verified
Q24: Mary Beth is risk averse and has
Q25: The problem of moral hazard arises because
A)life
Q26: Figure 27-5.The figure shows a utility function
Q27: Figure 27-5.The figure shows a utility function
Q28: Figure 27-5.The figure shows a utility function
Q30: A risk-averse person
A)has a utility curve where
Q31: Figure 27-2.The figure shows a utility function
Q32: Figure 27-5.The figure shows a utility function
Q33: A measure of the volatility of a
Q167: The largest reduction in a portfolio's risk
Unlock this Answer For Free Now!
View this answer and more for free by performing one of the following actions

Scan the QR code to install the App and get 2 free unlocks

Unlock quizzes for free by uploading documents