Figure 27-1. The figure shows a utility function. 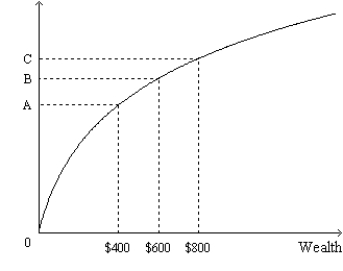
-Refer to Figure 27-1. Let 0A represent the distance between the origin and point A; let AB represent the distance between point A and point B; etc. Which of the following ratios best represents the marginal utility per dollar when wealth increases from $400 to $600?
A) 
B) 
C) 
D) 
Correct Answer:
Verified
Q3: Figure 27-2.The figure shows a utility function
Q5: Figure 27-1.The figure shows a utility function.
Q8: Figure 27-2.The figure shows a utility function
Q15: Figure 27-1.The figure shows a utility function.
Q21: Figure 27-4.The figure shows a utility function
Q22: Figure 27-4.The figure shows a utility function
Q28: Figure 27-5.The figure shows a utility function
Q36: Figure 27-5.The figure shows a utility function
Q37: Figure 27-3
The following figure shows the utility
Q38: Figure 27-3
The following figure shows the utility
Unlock this Answer For Free Now!
View this answer and more for free by performing one of the following actions

Scan the QR code to install the App and get 2 free unlocks

Unlock quizzes for free by uploading documents