Multiple Choice
Table 5-4
The following table shows the demand schedule for a particular good. 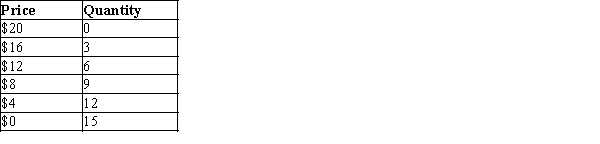
-Refer to Table 5-4. Using the midpoint method, when price rises from $8 to $12, the price elasticity of demand is
A) 0.4
B) 1
C) 1.5
D) 2.33
Correct Answer:
Verified
Related Questions

